Mitchel Daniel

Research Scientist with 10+ years of experience in data analysis, statistical programming (R, Python, SQL), science communication, and project management. Expert at identifying complex patterns in large, messy datasets.
Currently working at Florida State University, developing tools and data science pipelines to analyze and visualize unstructured data on fish morphology and genetics using multivariate models and machine learning classifiers.
View My LinkedIn Profile
Data science portfolio
Data Science Projects
Quantifying Variation in Complex Visual Traits
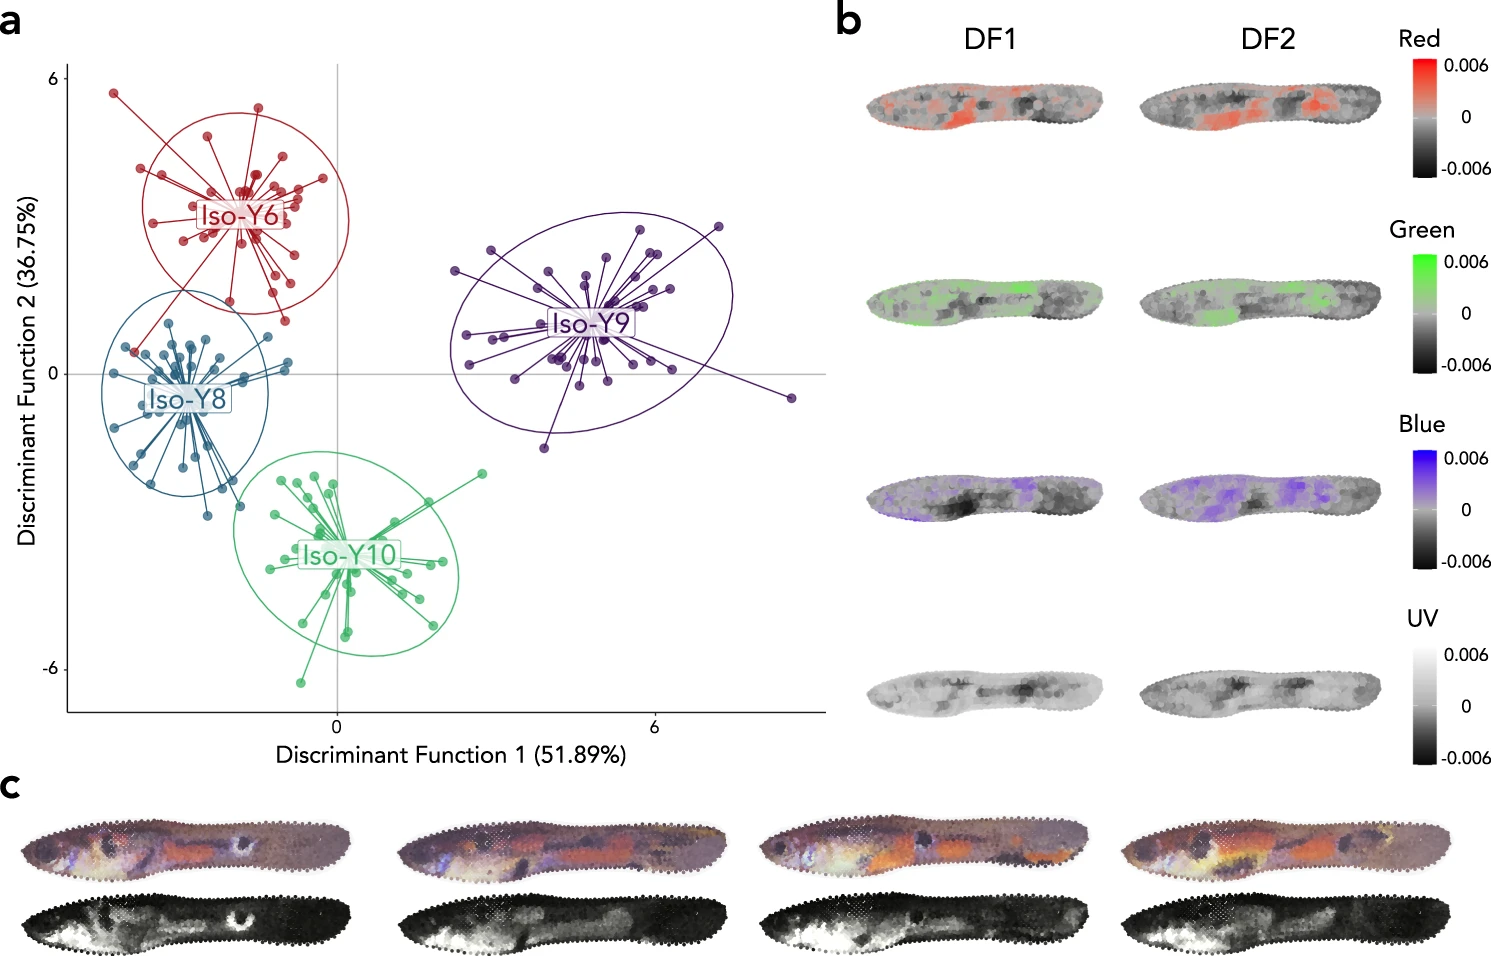
Populations of organisms that have high levels of trait diversity are better able to withstand environmental change. For this reason, measuring trait variation is useful for conservationists and policy makers to determine which species are most in need of protection. However, many biological traits are complex and challenging to quantify. In this project, I used R to develop a pipeline that quantifies variation in an extremely complex trait: the color patterns of male Trinidadian guppies.
I used the R package Colormesh to perform image segmentation, extracting >10,000 color measurements at analagous locations on the bodies of 120 fish. I then used Discriminant Analysis of Principal Components (DAPC) to identify and describe 4 clusters of color patterns, each of which is associated with a different Y-chromosome genotype. Using permutational MANOVA, I showed that the differences in color pattern between clusters are significant and consistent. My results show that by tracking the number of males with each of these color patterns types, or the underlying Y-chromosomes, researchers can monitor the color pattern diversity of populations.
The results of this project are published in Nature Ecology & Evolution.
Figure 1: Results of DAPC differentiating color patterns among males with different Y-chromosomes.
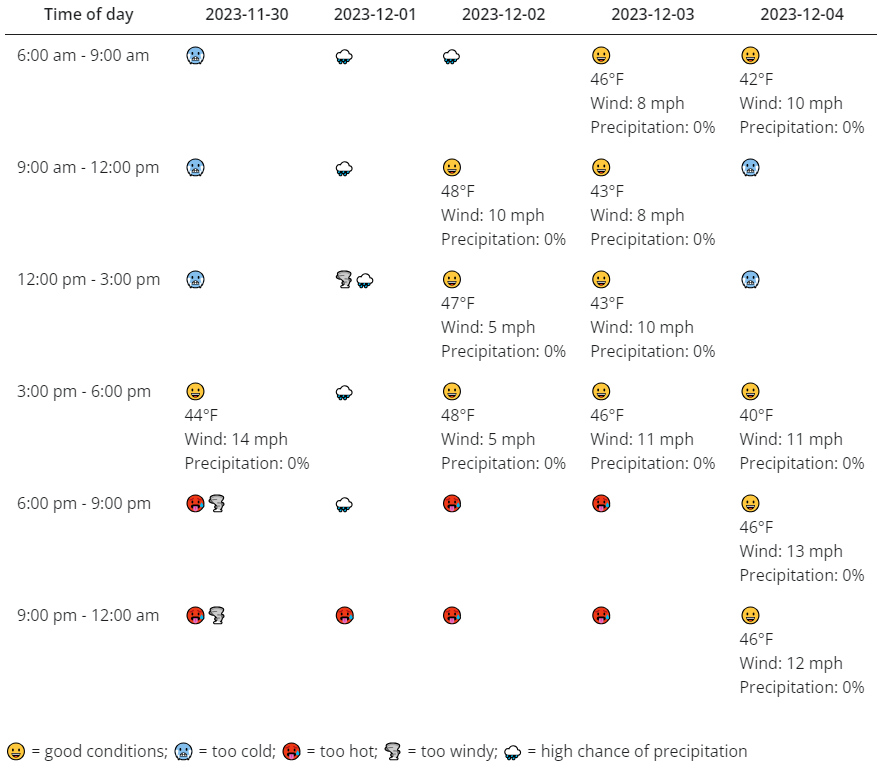
When to Play Pickleball App
Pickleball is the fastest growing sport in America, and it’s mainly played outdoors. I used Shiny for Python to develop an app that tells players when weather conditions will be suitable for outdoor pickleball. Users can customize the inputs to suit their individual weather preferences.
The app uses geolocation and weather APIs to pull weather forecast data, then summarizes the weather data to provide a quick, intuitive display of when to play.
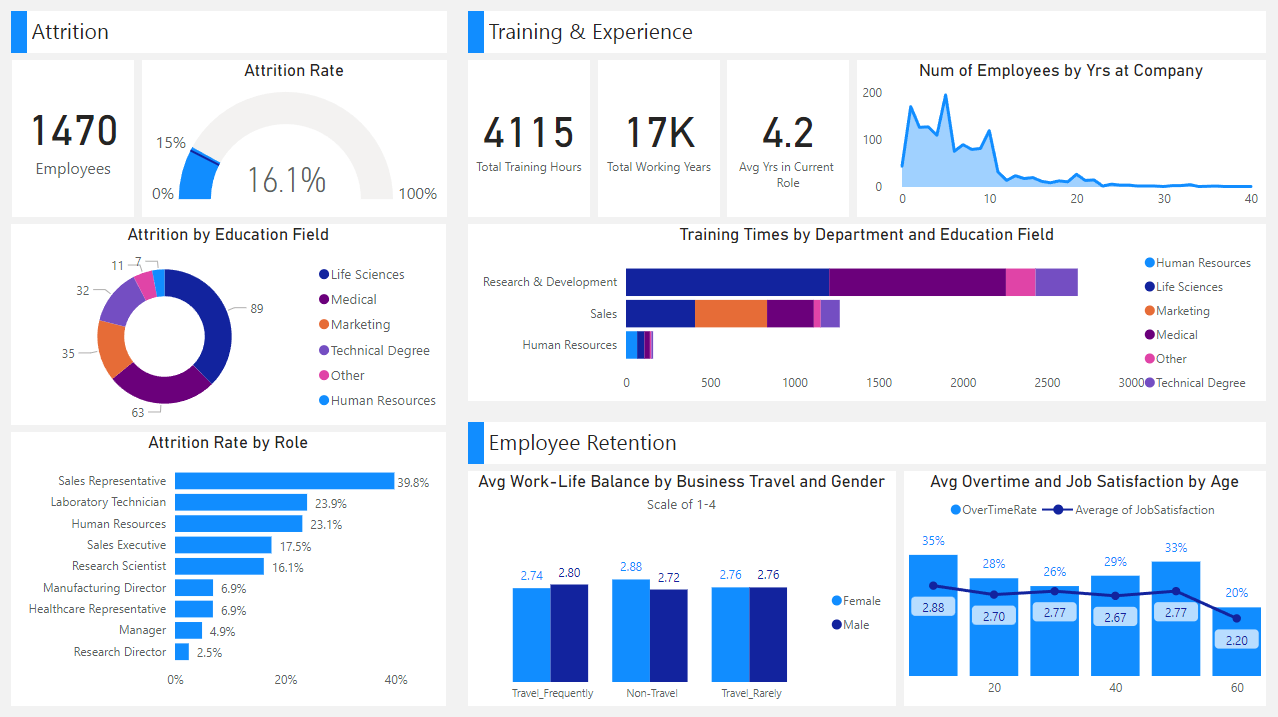
HR Analytics Dashboard
I developed a dashboard using Power BI that provides an overview of key HR data on employee attrition, factors affecting employee retention, and employee training and experience.
Tutorials
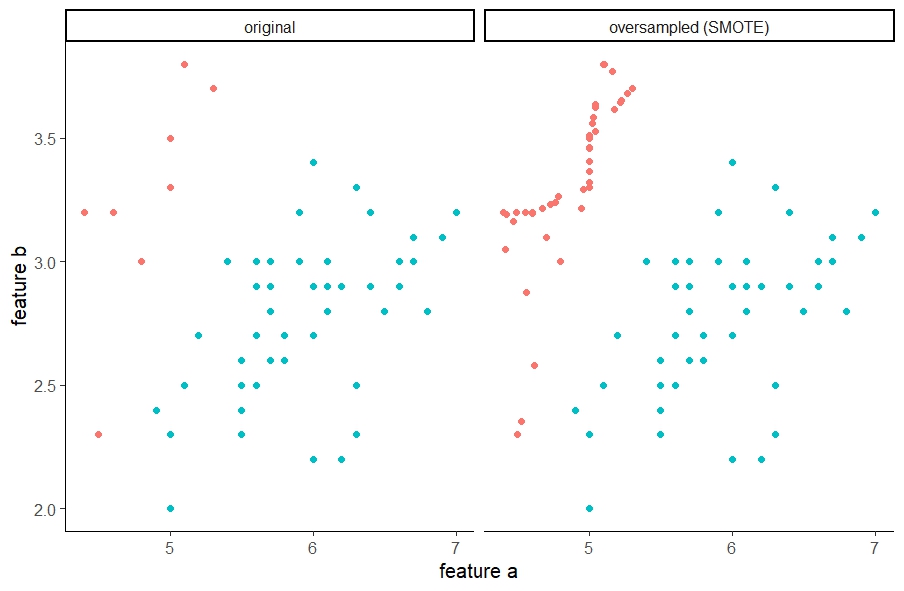
Imbalanced Learning Tutorial
Imbalanced data, in which the target class has an uneven distribution of observations, are common throughout the machine learning world. Imbalanced data presents unique challenges for training predictive models and assessing model performance. In this tutorial, I outline these challenges and present several model performance metrics that work well for imbalanced data. I then provide an overview of 4 widely-used techniques for effectively training predictive models on imbalanced data: undersampling the majority class, oversampling the minority class, synthetic minority oversampling technique (SMOTE), and cost-sensitive learning. I discuss the pros and cons of each technique and demonstrate how to implement them in R.
Focused on application over theory, this tutorial offers a useful primer for getting started analyzing imbalanced data.
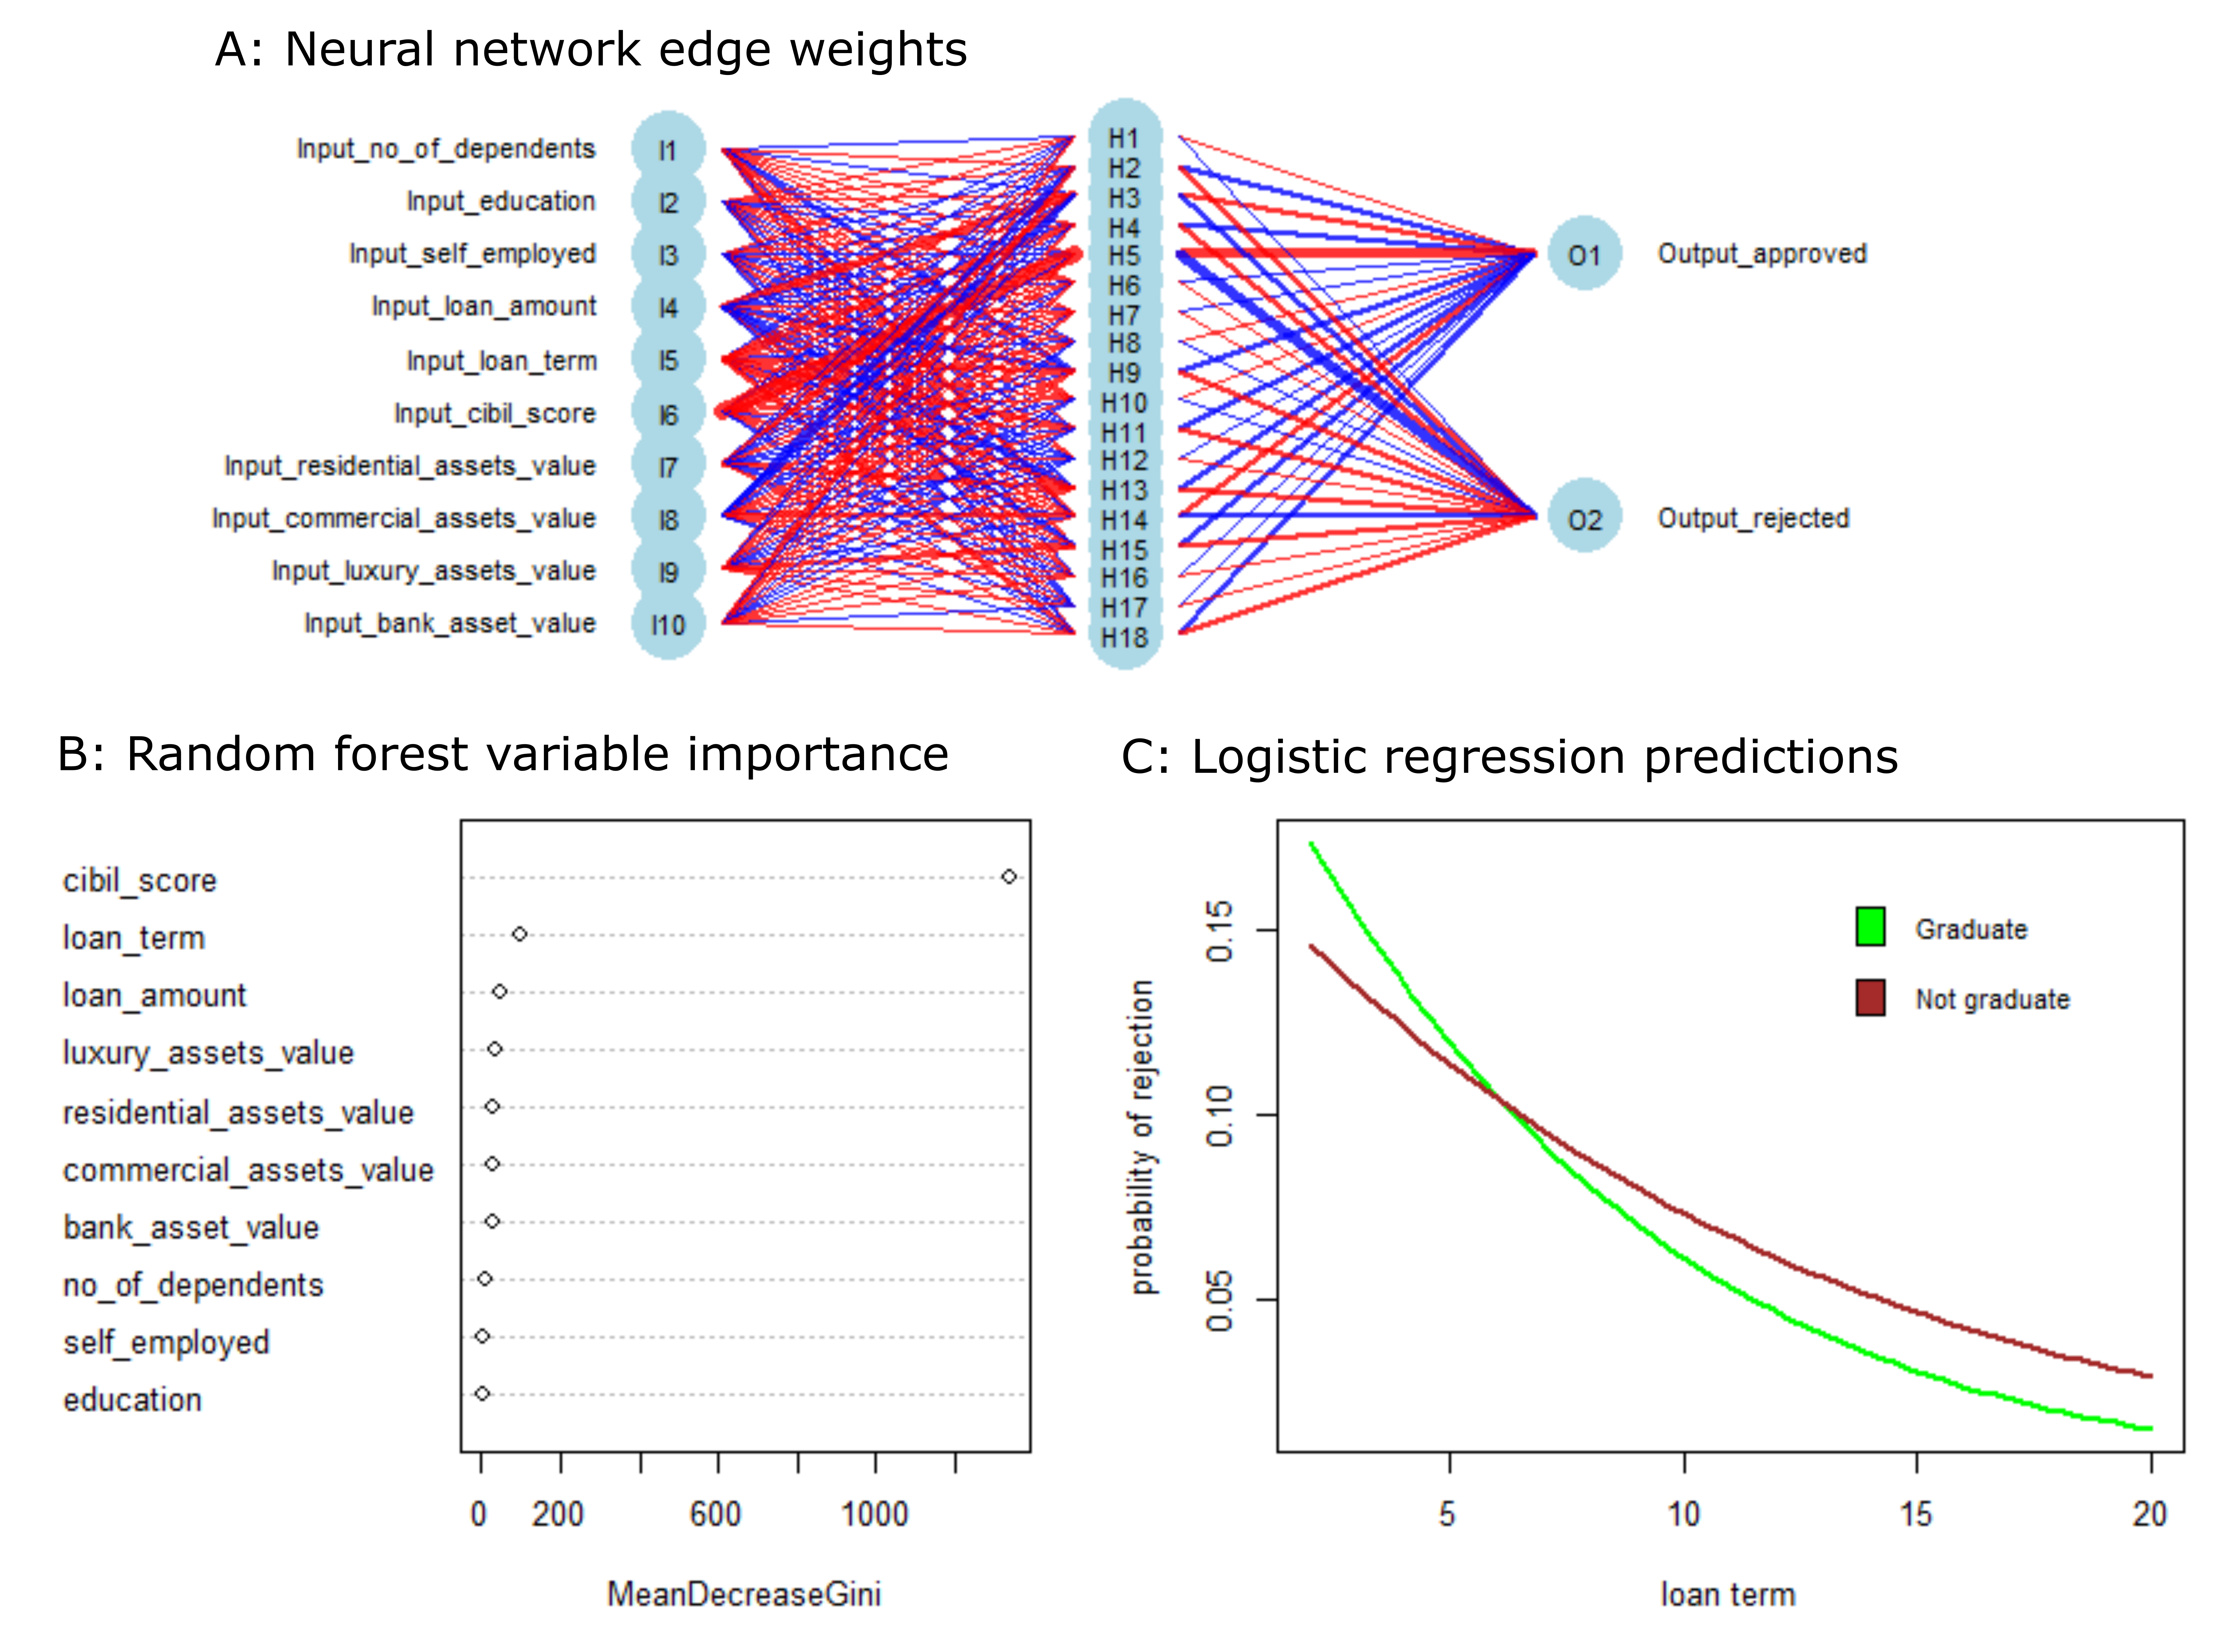
Machine Learning Classifiers Tutorial
Machine learning classifiers predict whether data belong to one or more discrete classes, and are used in a wide range of fields including healthcare, tech, and finance. In this tutorial, I provide an overview of 4 widely-used machine learning classifiers: logistic regression, random forest, neural network, and support vector machine (SVM). I discuss suitable use cases, the pros and cons of each method, and demonstrate how to implement, interpret, and visualize each classifier in R.
Page template forked from evanca